
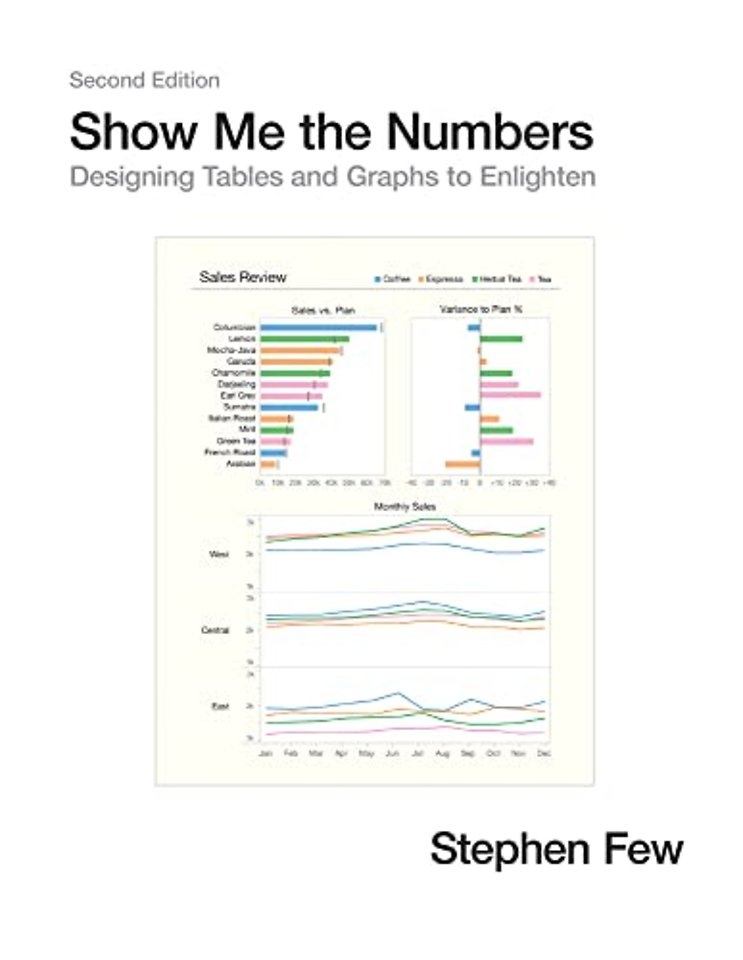
Show Me the Numbers
Designing Tables and Graphs to Enlighten
Gebonden Engels 2012 1e druk 9780970601971Samenvatting
Most presentations of quantitative information are poorly designed—painfully so, often to the point of misinformation. This problem, however, is rarely noticed and even more rarely addressed. We use tables and graphs to communicate quantitative information: the critical numbers that measure the health, identify the opportunities, and forecast the future of our organizations. Even the best information is useless, however, if its story is poorly told. This problem exists because almost no one has ever been trained to design tables and graphs for effective and efficient communication.
‘Show Me the Numbers: Designing Tables and Graphs to Enlighten’ is the most accessible, practical, and comprehensive guide to table and graph design available.
Trefwoorden
datavisualisatie tabellen grafieken communicatie visuele perceptie statistiek kwantitatieve informatie informatieontwerp data-analyse storytelling met data visualisatietechnieken presentatietechnieken dashboards kpi's grafisch ontwerp gestaltprincipes cognitieve psychologie excel business intelligence besluitvorming informatiehiërarchie preattentieve verwerking gebruikersinterface datageletterdheid informatiearchitectuur balanced scorecard visual design
Trefwoorden
Specificaties
Lezersrecensies
Inhoudsopgave
U kunt van deze inhoudsopgave een PDF downloaden
1. INTRODUCTION
2. SIMPLE STATISTICS TO GET YOU STARTED
3. DIFFERING ROLES OF TABLES AND GRAPHS
4. FUNDAMENTAL VARIATIONS OF TABLES
5. VISUAL PERCEPTION AND GRAPHICAL COMMUNICATION
6. FUNDAMENTAL VARIATIONS OF GRAPHS
PRACTICE IN SELECTING TABLES AND GRAPHS
7. GENERAL DESIGN FOR COMMUNICATION
8. TABLE DESIGN
PRACTICE IN TABLE DESIGN
9. GENERAL GRAPH DESIGN
10. COMPONENT-LEVEL GRAPH DESIGN
11. DISPLAYING MANY VARIABLES AT ONCE
12. SILLY GRAPHS THAT ARE BEST FORSAKEN
PRACTICE IN GRAPH DESIGN
13. TELLING COMPELLING STORIES WITH NUMBERS
14. THE INTERPLAY OF STANDARDS AND INNOVATION
APPENDICES
INDEX
Anderen die dit boek kochten, kochten ook
-
 Walter Savitch€ 100,54
 -
H.C. Theisens€ 61,75
-
Sjaak Laan€ 64,16
-
Alice Zhao€ 41,09
-
Rita Kohnstamm€ 66,95
-
Christian Bason€ 45,92


Rubrieken
- advisering
- algemeen management
- coaching en trainen
- communicatie en media
- economie
- financieel management
- inkoop en logistiek
- internet en social media
- it-management / ict
- juridisch
- leiderschap
- marketing
- mens en maatschappij
- non-profit
- ondernemen
- organisatiekunde
- personal finance
- personeelsmanagement
- persoonlijke effectiviteit
- projectmanagement
- psychologie
- reclame en verkoop
- strategisch management
- verandermanagement
- werk en loopbaan
